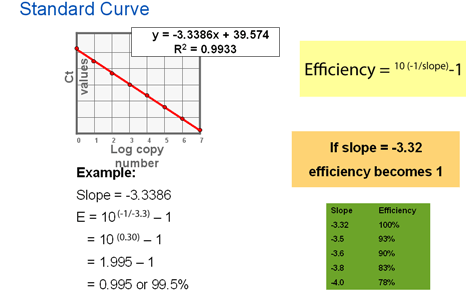
The efficiency of any PCR can be evaluated by performing a dilution series experiment using the target assay. We recommend a 10-fold dilution series. After properly setting the baseline and threshold, the slope of the standard curve can be translated into an efficiency value:

Slope of standard curve indicates PCR efficiency. The efficiency of the PCR should be between 90–100% (−3.6 ≥ slope ≥ −3.3). If the efficiency is 100%, the CT values of the 10 fold dilution will be 3.3 cycles apart (there is a 2-fold change for each change in CT). If the slope is below –3.6, then the PCR has poor efficiency.
Parameters that affect the efficiency of PCR
Several parameters can affect the efficiency of the PCR (ranked from most to least frequent, based on our observations at Applied Biosystems Support):
- Your samples may contain PCR inhibitors
- Your PCR primer and/or probe design may not be optimal
- Inaccurate sample and reagent pipetting
- The standard curve may not have been properly analyzed
Your samples may contain PCR inhibitors
RNA that contains inhibitory compounds (e.g., sample preparation reagents, excessive protein) can lead to partial or complete inhibition of downstream PCR. PCR inhibitors originating from the starting material include heparin (>0.15mg/mL), proteins such as hemoglobin (>1mg/mL), polysaccharides, chlorophylls, melanin, humic acids, etc. Contaminants from the nucleic acid extraction phase include SDS (>0.01% w/v), phenol (>0.2% w/v), ethanol (>1%), proteinase K, guanidinium, and sodium acetate (>5mM).
How to identify PCR inhibition
Analyze RNA samples with a UV spectrophotometer, bioanalyzer or Thermo Scientific™ NanoDrop™ spectrophotometer to assess quantity and quality. A high quality RNA sample should have an A260/A280 UV spectrophotometer reading close to 2. It has been observed that an A260/A280 reading of 1.8 suggests there is about 70–80% of protein in the samples; there are many proteins that inhibit both PCR and reverse transcription.
Inhibition plot: You can use real-time PCR data from standard curve plots to determine whether inhibition is occurring at a level that causes spurious results. When used to characterize inhibition, these semi-log standard curves are referred to as inhibition plots. Please refer to the RNA Preparation and Reverse Transcription section of the Guide to Performing Relative Quantitation of Gene Expression Using Real-Time Quantitative PCR.
Solution
- Perform RNA purification process on a sample using a new purification method. Choose your RNA extraction kit based on sample type. Refer to the RNA isolation kit decision tree to help make the right reagent/kit choice.
- Further purify your samples: RNA with a significantly lower A260/A280 ratio should be further purified by phenol-chloroform extraction, LiCl precipitation, or washing to remove residual salt.
- Test your sample at a lower template concentration at which it is known that PCR inhibition does not affect the real-time PCR results.
Your PCR primer and/or probe design may not be optimal
Optimal design of PCR primers and probe is mandatory for efficient PCR.
Custom Applied Biosystems™ TaqMan® Gene Expression Assay design is based on a template sequence provided by the customer. You can also design your own assays using other programs, and send the oligonucleotide sequences to us for synthesis. You must perform bioinformatic evaluation of the sequences prior to submission to avoid PCR failure.
Read Bioinformatic Evaluation of a Sequence for Custom TaqMan Gene Expression Assays to understand how to run a bioinformatics evaluation of a template sequence.
Bioinformatic evaluation allows you to accomplish three tasks:
- Identify a unique sequence by using BLAST (basic local alignment search tool). If the sequence submitted is unique (or from a non-homologous region), the assay that is designed on this template only detects the transcript of interest.
- Mask low complexity regions by using RepeatMasker. Low complexity regions, such as ALU sequences, are usually found within genomic DNA sequences. If you design your assay over these regions, the primers or probe will be depleted quickly if there is any genomic DNA in the samples.
- Mask SNP sites in the sequence, so that primers and probes will not be designed over SNP sites.
Inaccurate sample and reagent pipetting
Accurate pipetting with regularly calibrated pipettors is critical to obtaining accurate and precise data. Low volume pipetting (i.e., <5 µl) can contribute to imprecision, and pipetting of volumes less than this is not recommended unless the pipettors are designed for these low volumes and are regularly calibrated. It is also recommended to briefly spin down the sealed plates prior to running on the instrument, using low speed centrifugation. The table below lists some of the consequences of inaccurate pipetting.
